Sunday, August 27, 2006

Peter Lynch on Beating the Street 4

“Japanese investors, we hear, paid little heed to earnings and focused their attention to cash flow – perhaps due to shortage of the former. Companies spend money like drunken sailors, especially on acquisitions and real estate, are left with a huge depreciation allowance and a lot of debts to pay off, which gives them a high cash flow/low earnings profile.”

“Japanese banks were making 100% loans on zero collateral for office buildings where in the most optimistic scenario the rents would barely cover the expenses.”

Friday, August 25, 2006

Peter Lynch on Beating the Street 3

“It isn’t the head but the stomach that determines the fate of the stockpicker.”

“Good information is useless without the willpower. In dieting and in stocks, it is the gut and not the head that determine the results.”

“Keeping the faith and stockpicking are normally not discussed in the same paragraph, but success in the latter depends on the former. You can be the world’s greatest expert on balance sheet or p/e ratios, but without faith, you’ll tend to believe the negative headlines.”

Peter Lynch on Beating the Street 2


“Just because a stock goes down doesn’t mean it can’t go lower.”

“You should not buy a stock because it’s cheap but because you know a lot about it.”

Wednesday, August 23, 2006

Peter Lynch on Beating the Street 1

“There’s a Tolstoy story that involves an ambitious farmer. A genie of some sort offers him all the land that he can encircle on foot in a day. After running at full speed for several hours, he acquires several square miles of valuable property, more soil than he could till in a lifetime, more enough to make him and his family rich for generations. The poor fellow is drenched with sweat and gasping for breath. He thinks about stopping—for what’s the point of going any further?—but he can’t help himself. He races ahead to maximize his opportunity, until finally he drops dead of exhaustion. This was the ending I hoped to avoid.”

Wednesday, August 16, 2006

Low Risk, Low Return; High Risk, High Return?

People often say: “Low risk, low return; high risk, high return.” Is it a truth? Let’s us examine it through an example of the investments made shown below.

Fund CAT is the best performer in Malaysian Unit Trust (Mutual Fund) industry for the period of more than 5 years as per 23rd June 2006. In the stable of around 400 funds to choose from, whether it is equity fund, bond fund, mixed fund, money market fund and so forth, it is the fund that gives the best return to its unit holders.

Fund CAT performance from 25th June 2001 to 23rd June 2006 is 113.04% which translated into 16.33% Compounded Annual Growth Rate (CAGR). One should notice that 2001/02 was the most bargain market since 1999. When count from an inception date of Fund CAT, which is in 1999, the fund performance is 90.5%, which translated into 9.67% CAGR.

How about placing all investment in a single stock? Is it really a high risk investment? Take an example of RLQ. RLQ is a resource-based company and its core activities are in 3 categories, namely Marine Products Manufacturing (MPM), Crude Palm Oil Milling (CPOM) and Integrated Livestock Farming. In the same period, RLQ generates a return of 119.27%, which is 17% CAGR. Bear in mind that RLQ is not the best performer of the market. Furthermore, since RLQ main businesses are in resource-based industry, any negative happenings would have impact to its performance. In the period mentioned, RLQ experienced few incidences such as high price of raw materials such as soy bean meal and corn meal, 2 bird flu threats and tsunami which have a huge negative impact to its underlying businesses. Nevertheless, it gives a better performance compared to Fund CAT which adapts a diversification policy.

While at a glance, Fund CAT is a more low risk investment made since its investments are well diversified into various sectors, money market and cash. At the same time, investment made on RLQ seems pose a high risk to its investors since RLQ businesses are in resource based industry, meaning that any negative happenings in the industry would cause negative impact to RLQ bottom line and ultimately to its investors. Nevertheless, anyone who chooses either Fund CAT or RLQ as his investment would reap similar return to his nest egg. One should always remember that investment made through rear mirror would not guarantee his investment success. When an investment result is most of the time relied on capability of the investment manager, it is worthwhile to aware any changes in fund’s investment team members. They are the one who decide the investment result of yours.

Note: As we are investors with long term perspective, any investment with less than 5 years is meaningless. Thus, we only use investments with minimum 5 years period for comparison. Remember, investment is a marathon, not a 100 meter race.

Saturday, August 12, 2006

Oasis of Eternity -- Michelangelo 6: The Dome of Saint Peter's Basilica


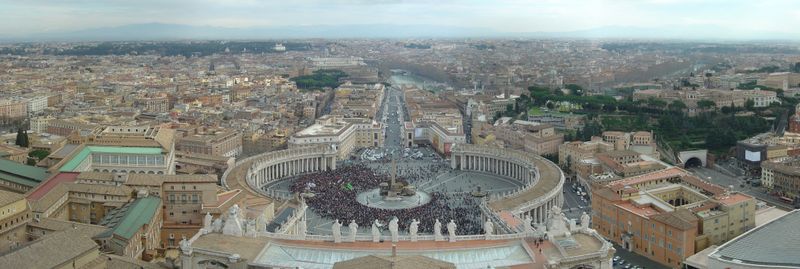
Michelangelo, who often called as “Il Divino” (The Divine One) in his life time designed and became a chief architect the dome (cupola) of Saint Peter’s Basilica, Vatican City, Rome in 1546. After his death, the work continued by Giacomo della Porta with the assistance of Domenico Fontana.


The dome has a diameter of 42 meter and it is the largest dome in the world. It is reaching 138 meter high. The site is the buried site of Saint Peter, one of the apostle of Jesus Christ in 64 A.D.

Wednesday, August 09, 2006

Invest for Long Term??

Excerpts from: http://www.theedgedaily.com/

“The Malaysian equity funds have posted "respectable returns" over the mid- to long-term periods, the Federation of Malaysian Unit Trust Managers (FMUTM). It said based on Standard & Poor's report on the fund performance as at July 28, 2006, the average returns for Malaysian equity funds for the seven-year period was 24%, five-year period 56% and three-year period 26%.”
Period (year) 3 5 7
UT Return (%) 26 56 24
UT CAGR (%) 8.01 9.30 3.12
FD Return with 4% CAGR (%) 12.49 21.67 31.59

As we can notice from the table above, by placing your money in unit trust (mutual fund) investment for 3 years, the return for the period would be 26% and when it translates to Compounded Annual Growth Rate (CAGR) which is 8.01. Similarly, for the period of 5 and 7 years, the return is 56% and 24% respectively and for CAGR for both, the former is 9.30% and the later is 3.12%. What will you get if you place your investment in “risk-free” Certificate of Deposit (CD) or known as Fixed Deposit (FD) in English Commonwealth countries? With 4% return annually, the figure will shock us!! For the period of 7 years, this “risk-free” investment performs better than unit trust (mutual fund) investment with more than 7%. When handling your hard-earned monies on hoping for better value creation by those fund managers, it seems that they do not fulfill your hope and as they promise – create value to its investors.


While the promoters of the unit trust investment always brainwash us “look for long term”, “let professionals handle your investment” and so forth, the reality is so cruel – it creates no value at all to the investors for longer term. When the promoters once again claim for the “outstanding” performance for 5 years period, bear in mind that the period is started from the 2001/02 market where it was the lowest. The best fund manager is not who gets the highest return when it is bull market, it is who gets the best result when it is bear market. It reminds me once again a famous quote by Warren Buffett: “It’s when the tide down, only you know who is swimming naked.”

Monday, August 07, 2006

Oasis of Eternity -- Michelangelo 5: David

David, is one of the two masterpiece sculptured by Michelangelo from 1501 to 1504. The marble statue is 17 ft height. It originally placed in front of the Palazzo Vecchio, Florence but later on moved to Accademia Gallery, Florence in 1873 to protect it from damage.

The statue portrays the Biblical King David before he battles with Goliath. It represents a spirit of Florentine Republic, an independent city state threaten by more powerful rival states. To the citizen of Firenze (Florence), David was a symbol of fortezza and ira, strength and anger. It is a cunning victor over superior enemies. Unlike previous Davids, who shown after victory against Goliath, David by Michelangelo shows his determination and courage to fight against a more superior enemy.

There are two replica of David in Firenze, one in front of the old city hall, and one on a hill overlooking the city.

Saturday, August 05, 2006

Oasis of Eternity -- Michelangelo 4: The Pieta

The Pieta, which many regard as the greatest sculpture ever made is located in Saint Peter’s Basilica, Vatican City, Rome. It is created by Michelangelo from 1498 to 1500. The marble sculpture was finished before he turned to 25. The art marble depicts the body of Jesus in the arms of his mother Mary after the Crucifixion.

Giorgio Vasari, Italian painter and architect in his “Lives of the Artists” published in 1550, comment: "It would be impossible for any craftsman or sculptor no matter how brilliant ever to surpass the grace or design of this work, or try to cut and polish the marble with the skill that Michelangelo displayed. For the Pieta was a revelation of all the potentialities and force of the art of sculpture. Among the many beautiful features (including the inspired draperies) this is notably demonstrated by the body of Christ itself. It would be impossible to find a body showing greater mastery of art and possessing more beautiful members, or a nude with more detail in the muscles, veins, and nerves stretched over their framework of bones, or a more deathly corpse. The lovely expression of the head, the harmony in the joints and attachments of the arms, legs, and trunk, and the fine tracery of the veins are all so wonderful that it is hard to believe that the hand of an artist could have executed this inspired and admirable work so perfectly and in so short a time. It is certainly a miracle that a formless block of stone could ever have been reduced to a perfection that nature is scarcely able to create in the flesh."

Tuesday, August 01, 2006

Capital Guaranteed Fund III

Previous posts on Capital Guaranteed Fund:

Capital Guaranteed Fund I
Capital Guaranteed Fund II

Everybody aware of inflation. Due to this animal, $100 we have after a year (FUTURE VALUE) will not allowed you to purchase a same amount product which is quoted in today price (PRESENT VALUE). Giving 5% inflation rate per annum, your $100 of FUTURE VALUE (after a year) will only allowed you buy a product which is quoted today at $86.38 (PRESENT VALUE). Thus, after a 3 years maturity period, RM 300 million of FUTURE VALUE is equivalent to RM 259.15 million of PRESENT VALUE!! With capital guaranteed capped at RM 300 million (FUTURE VALUE) after 3 years, it’s for sure fund could deliver their capital guaranteed even their investment result is poor. They are left with RM 13.21 million (RM 272.36 million – RM 259.15 million) to play around even their investment result delivered no result at all for the entire 3 years period! That’s a “SURE CAPITAL GUARANTEED, ZERO RISK” Investment!!

The calculation above is simplified to an illustration purpose. The assumption made is there is no return (0%) for entire 3 years period.


When fund tagged with “Capital Guaranteed”, it should at least preserve its fund holders’ value. This means that for RM 300 million (PRESENT VALUE), it should at least appreciate to RM 347.29 million (FUTURE VALUE) to align with its tag of “Capital Guaranteed”. If RM 300 million (PRESENT VALUE) remain as RM 300 million (FUTURE VALUE), it actually deteriorates its fund holders’ value at the rate of 5% per annum! What’s the point for investors to invest into these funds if it serves no purpose at all. After all, they could place their money into bank’s Certificate of Deposit (CD) or Fixed Deposit (FD) to enjoy “Capital Guaranteed, Zero Risk” return. Currently, a FD depositor in Malaysia enjoys 3.7% return per annum. So, with RM 300 million (PRESENT VALUE), his account balance will show RM 334.55 million (FUTURE VALUE) after 3 years. That’s almost 35% difference!

What You See Is What You Get? III


As you notice, the difference of BP-BP and ROI decreases when the investment period is longer. From the table, you will shock to notice that you actually incur loss of 5.28% if you cash out after a year of investment. That means if you invest $ 10,000 at the beginning and cash out after a year, you only manage to get back $ 9,472!!

How about the return for Certificate of Deposit (CD) or known as Fixed Deposit (FD) in some countries? Assuming CD/FD could give you 4% return per annum, the return over 5 years period would be:

Year 4% return per annum ROI (%)
0 1 0
1 1.04 4
2 1.0816 8.16
3 1.1249 12.49
4 1.1699 16.99
5 1.2167 21.67


When you compare ROI of Fund KSA and CD/FD, you will notice that ROI of Fund KSA only outpaces CD/FD after 4th year!! Amazing, isn’t it? When you pay hoping for get the better return as compared to “risk-free” CD/FD investment, the outcome is shocking. That is no wonder, the promoters always ask you to invest for long term – the longer the better. We do agree that investment should always for long term (more than 7 years). But, this only applies to the investment that creates value to its investors. If you choose a lousy investment, the longer you hold, the worse you get. Time is unemotional, it would not sympathize you because you choose a lousy investment. In fact, time would punish you if you choose a lousy investment. Time only reward to those who choose a good investment, this is the core of the value investment.

Next time, when the promoters of Mutual Fund (Unit Trust) try to persuade you to purchase the fund and show you how good the return, you should ask them one question: the return is on whose perspective, Fund or investor, that’s you who pull out the money to feed them.

Monday, July 31, 2006

What You See Is What You Get? II


When mutual fund (unit trust) shows its performance, it is in Bid-to-Bid performance. For example, when it shows 10% return per annum, it indicates 10% return per annum of its Bid Price, ie: Bid Price on 2nd January 2007 is $ 1.10 as compared to Bid Price on 2nd January 2006 of $1. Bear in mind that return on Bid-to-Bid is NOT Return On Investment (ROI) of the unit holders. Let’s consider 10% Compounded Annual Growth Rate (CAGR) where Fund KSA managed to achieve for 5 years, what will the investors get if he decide to cash out at the end of 5years:

Year OP ($) BP ($) BP-BP (%) ROI (%) Diff (%)
0 1.0000 0.935 0 0 0
1 1.0835 1.0131 8.35 -5.28 NA
2 1.1740 1.0977 17.38 2.63 561.09
3 1.2720 1.1893 27.20 11.20 142.83
4 1.3782 1.2886 37.82 20.49 84.61
5 1.4933 1.3962 49.33 30.55 61.48


John invested $ 10,000 at the beginning of 5 years period. He does not cash out until the end of the period and at the same time, he reinvested all dividends. After 5 years period, Fund KSA announces that it achieves 49.33% return (that is in term of Bid-to-Bid). When John sold all his units, he found out that he only manage to get $ 13,055 (1.3962 * 9,350 units) instead of $ 14,933. His real Return On Investment (ROI) in term of investor’s perspective is 30.55% instead of 49.33%, which is 61.48% difference. You might ask where is the money gone? Remember, there is always costs involved to feed the interested parties, ie: 6.5% Sales Load and 1.5% Annual Management Fee.

Thursday, July 27, 2006

What You See Is What You Get? I


Whenever someone makes an investment, being it in equities, mutual fund (unit trust), real estate and so forth, his objective is to maximize his Return On Investment (ROI). In Mutual Fund, a conventional belief of its return is around 12% per annum. An outcome of the investment return will varied depends on different strategies employed by the investors. Bear in mind that in mutual fund investment, there are 2 typical charges, ie: Sales Load which hover around 5 to 6.5% and Annual Management Fee at 1.5%. Whenever we look at the table of the mutual fund, there would be 3 columns, which are Offer Price (OP), Bid Price (BP) and Net Asset Value (NAV). The difference between OP and BP constitute Sales Load. To make a picture clearer, let’s show you an example.

John invested $ 10,000 in Fund KSA on 2nd January 2006 at OP of $1. With this, he will have 9,350 units of the fund (Note: 6.5% Sales Load). After a year, Fund KSA OP is at $ 1.20. At a glance, it shows a return of 20% per annum. Quite impressive with this return rate. If he sold all of his 9,350 units, he will get $ 10,333 (9,350 * $ 1.10517). Instead of the 20% return, he only manages to get the return rate of 3.33% of his original investment. Playing magic, huh? Sometimes, what you see is NOT what you get….

Tuesday, July 25, 2006

Dollar Cost Averaging (DCA)?


DCA gains its popularity especially by the mutual fund (unit trust) investors since it is promoted by the interested parties. What is DCA? One might ask. It is a systematic and regular investment of a fixed amount of money regardless of the price level, meaning that it does not bother the up and down of the market. Investor will get more units when prices are down and fewer units when prices are up.

The promoters claim that by adopting this system, it will reduce investment risk because the risk already averaging out. The most wonderful thing is it needs not your close monitoring to the market. Sound simple and great, isn’t it?

Before we jump into a conclusion whether DCA is practical is a real world or not. Let’s examine what’s your reaction for this scenario:

There are 10 different stalls selling local cuisine. You are having your dinner every evening and you have a freedom to choose which stall you will have your dinner. From the beginning, you might rotate your dinner among these stalls because you want to try something new and you want to know which is the best. After a while, you know exactly Johnny Stall is the best with a reasonable price tag at $ 10 for a dinner. You do not choose others because you know well that for some stalls, the foods might not fresh, the cleanliness of the stalls is not accepted and so forth. Thus, you will go to Johnny Stall for your dinner every evening.


One day, as regular as your previous evenings, you have your dinner in Johnny Stall. After dinner, you pull out $ 10 for the bill. Surprisingly, Johnny presents the bill with a price tag of $ 20! Being curious you ask him the reason. He answer: “I’m not in the good mood today.”

The next day, you go to the same stall and after a dinner, you pull out $ 20 for a bill. This time, Johnny only charges you $ 5.

After several times, you know well that Johnny stall’s dinner is the best and the quality remain the same. The only difference is its bill – it depends to the mood of Johnny. In bad mood times, he would charge you above fair value of $ 10 which can be as high as $ 20. While in his good mood times, he would present you with a same quality dinner but in discounted price, could be as low as $ 5. You need not be a rocket scientist to know when is the best time to have your dinner, don’t you?

We need to have a dinner every evening and thus we have no choice to pay for the bill asked by Johnny. But, for a rational intelligent investor, there is no timeframe for him to invest. It could be no investment made at all for the entire 5 years and when opportunities arise, there could be 5 or more investments made in a year. It all depends to the market – Market is your servant, do not reverse it.


By adopting DCA, it is just insane to invest in whatever price tag. When in real life, you definitely would not buy something when the price tag is far beyond a fair value, will you do it in your investment? When promoters claim that by adopting DCA, it reduces investment risk, so does the return rate of the investment result.

Monday, July 24, 2006

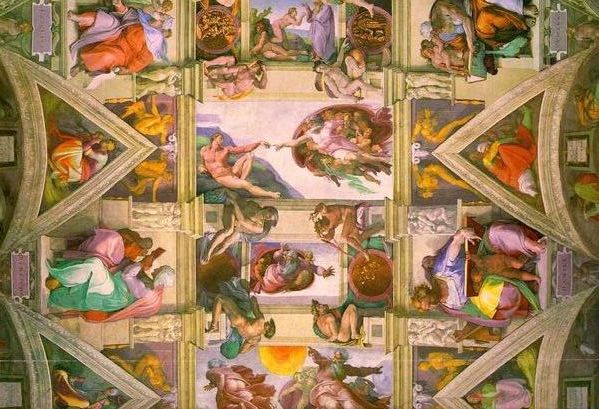
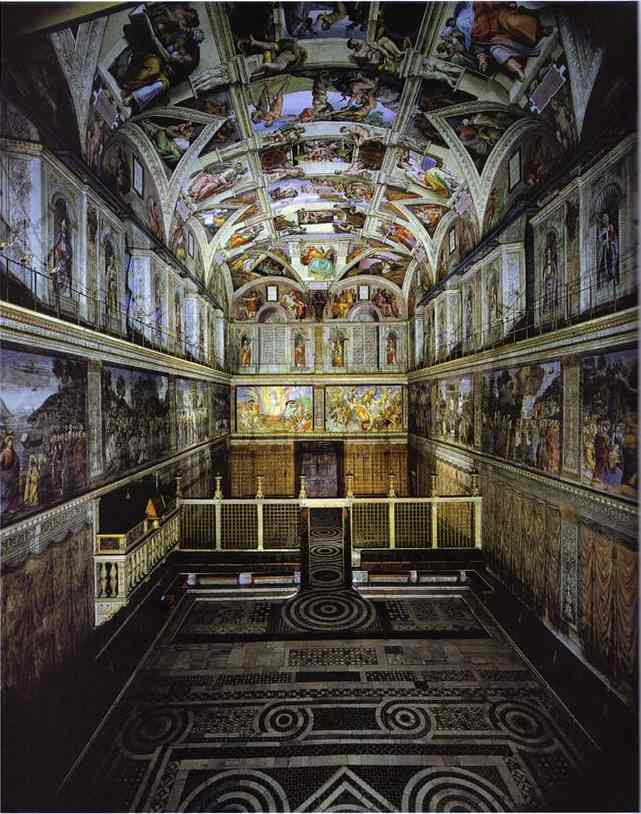
Oasis of Eternity -- Michelangelo 3: Sistine Chapel Ceiling


The paintings on the ceiling of Sistine Chapel were done by Michelangelo from 1508 to 1512. The paintings include 9 scenes from the Book of Genesis, the order of the scenes from the altar towards the main entrance:

1. The Separation of Light and Dark
2. The Creation of the Sun, Moon, and Planets
3. The Separation of Land and Water


4. The Creation of Adam
5. The Creation of Eve
6. The Temptation and Expulsion


7. The Sacrifice of Noah
8. The Flood
9. Drunkenness of Noah


Friday, July 21, 2006

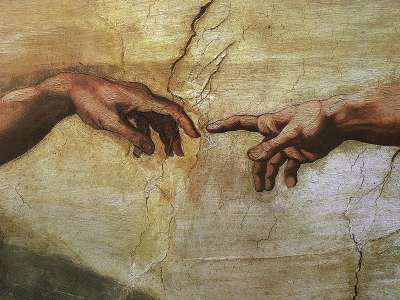
Oasis of Eternity – Michelangelo 2: The Creation of Adam


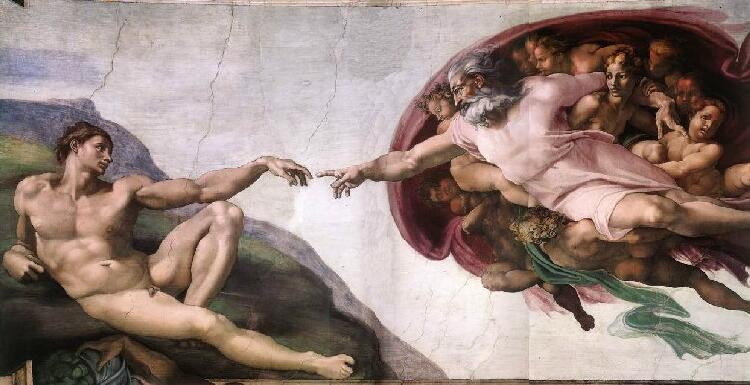
The painting is done by Michelangelo in 1511 on the ceiling of Sistine Chapel, Vatican City, Rome. Eve, appeared in Adam's left leg. Besides his expertise in arts, his human anatomy’s knowledge could not be under estimate. In 1990, a physician named Frank Lynn Meshberger noted that the background figures and shapes portrayed behind the God appeared to be an anatomically accurate picture of the human brain, including the frontal lobe, optic chiasm, brain stem, pituitary gland and the major sulci of the cerebrum. Also, the red cloth around the God has the shape of human uterus and the green scarf hanging could be a cut umbilical cord.

Wednesday, July 19, 2006

Mutual Funds Hopper

In the job market, the objective of a job hopper is to gain more benefits compared to his previous job. Will he achieves his objective? It depends to his luck as well as his capability. How about mutual funds’ holders? Very frequent, either by his own judgment or persuasion from the interested parties, the holder changes his portfolio from Fund A to Fund B and so forth. The objective is similar: to gain more. But, will he achieve his? The answer: SURE LOSE GAME.

The answer is very obvious since there are underlying costs involved in the mutual funds, ie: Sales load and annual management fee.


Take one example: Johnny invests $ 10,000 by his own for the beginning and let the capital and its return compounded yearly. The investment return is 10% per annum. What he gets after 30 years patience? $ 174,494. How about Ken who also invests $ 10,000 in mutual funds for the beginning with same return rate but he changes his portfolio every year, meaning that in 1st year, he is in Fund A, 2nd year in Fund B, 3rd year in Fund C and so forth? Waiting patiently for 30 years as Johnny, what will he gets? $ 23,234!! That is a difference of $ 151,260 or 651%!! The more or longer Ken invests, the more he loose out from the game.

Why there is so much difference? That’s because of Sales load imposed by Mutual Fund to its holders. The Sales load is ranged from 5 to 6.5%. Its existence is to channel to its promoters, so that the promoters can put efforts to sell the products. Remember whenever you intend to purchase mutual funds, there are flocks of difference salesmen come to your place and tell you their funds are the best and persuade you to invest on them? That’s the cost of doing business – there is no free lunch in this world. If there is no incentives for these promoters, who will sell hardly for the fund?

Bear in mind in the example given, we do not include a typical 1.5% annual management fee. If we add it into the example, the difference will be larger.

Tuesday, July 18, 2006

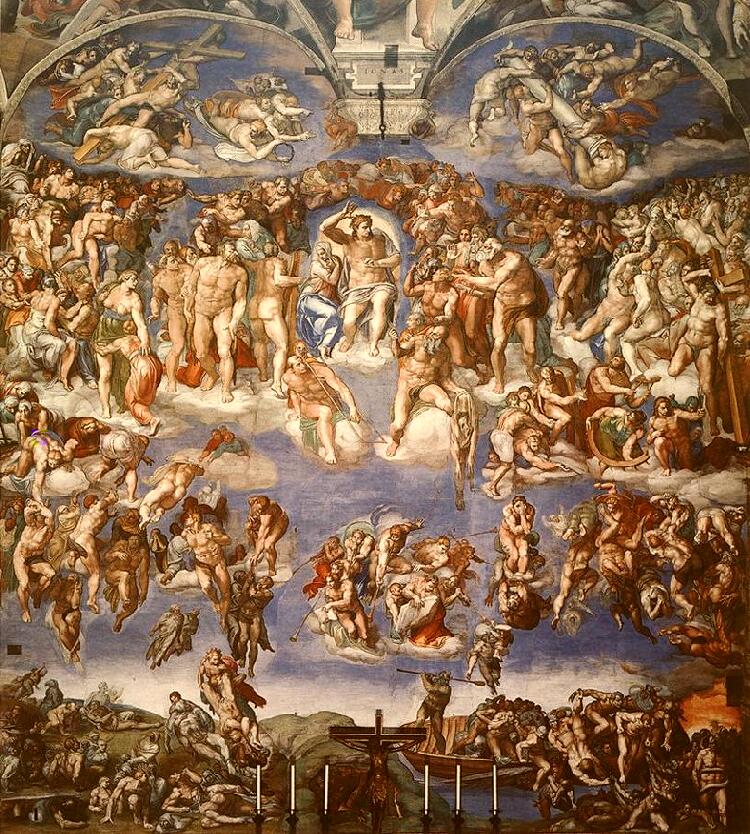
Oasis of Eternity -- Michelangelo 1: The Last Judgement Day


The picture (1537-41) is a masterpiece of Michelangelo on the ceiling and altar wall of Sistine Chapel, Vatican City, Rome. The artist's self-portrait appears twice in the picture: in the flayed skin with Saint Bartholomew is carrying in his left-hand, and in the figure in the lower left hand corner, who is looking encouragingly at those rising from their grave.

Saturday, July 15, 2006

Mutual Funds @ Super Highway


Article by Louis Lowenstein about the turnover rate of the mutual funds (unit trust).

Have you ever care about how fast your fund managers changing their portfolio? The answer? 100% and for some even as high as 305% per year!! What is this means? That means holding period of the portfolio is less than a year (100% per year) or less than 4 months (305% per year)!! While purchasing the fund, the promoters always tell you “invest for long term”, at the same time, they are doing the reverse. “Long term” by their definition seems less than a year from their action.

In any business, a period of a year seldom gives you a clear picture of how a company performs. In such a short period, very often the performance of the company is merely a luck. If the company delivers a handsome result this year, you can’t just assume the same result will repeat for next years. For example, in 2004, steel production companies enjoyed a handsome result but the reverse happened in 2005.


The high rate of portfolio turnover by fund managers only indicates their speculative mentality. They try to time the market and most often they are wrong. When the management fee is tied to the size of the fund and their net worth is not tied to the fund they manage, there is no wonder why irresponsible action occurs.

The funds managed by managers with speculative mentality would only deliver a poor result to their fund holders. The result could be as wide as 18% per year over the period of 5 years as compared to value-oriented funds. With compounded effect, if you invest $ 10,000 and the difference is 18% per year, see the difference:

Year Value Fund Speed Fund Difference (%)
0 10,000 10,000 0
5 22,878 10,000 129
10 52,338 10,000 423
20 273,930 10,000 2,639
30 1,433,706 10,000 14,237

Will you invest in Speed Fund anymore??

Warren Buffett: The Man

Warren Buffett with Cahrlie Rose Interview:
1) Part I
2) Part II
3) Part III

Very interesting topics mentioned by a philanthropic billionaire.

Joan Miro


Dona i ocell (Woman and bird) in Parc de l'Escorxador, Barcelona by Joan Miro. He is one of the famous Catalan artists in Barcelona whose among others include Antoni Gaudi, Salvador Dali and Pablo Picasso. There is a museum of his works located in Montjuic Hill, not far from here.

Thursday, July 13, 2006

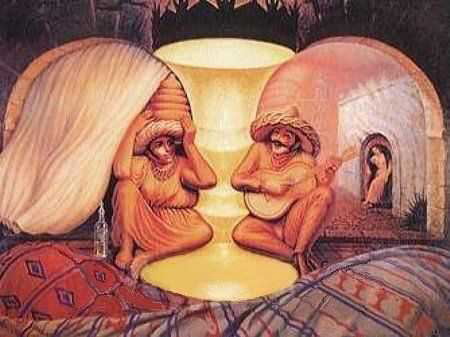
Illusion of Focus


Question:
1) How many legs do the elephant have in Picture A?

2) In Picture B, focus your concentration into the cross. After few seconds, what would you discover?

3) What can you see in Picture C and Picture D?

4) Assuming the dog tail is a leg, how many legs does the dog have?

Answer:
1) 4
2) Some red dots disappear
3) In Picture C, there are 2 words: You and Me; In Picture D, the 2 words are: Teach and Learn
4) 4. No matter what the assumption you make, a tail still a tail, it would not change to a leg as you assume.

There are too many illusions in the world making us losing our concentration. For example, CEO of Company ABC in his prospectus will project his company will have net earnings of $ 100 million in the coming year. Before he ends his words, he will add: “Barring unfavorable circumstances, the projection made is based on the assumption of bla bla bla…..”. Remember the lesson you learn from the Question 4? “A tail will still remain a tail, no matter what the assumption you make.” Similarly, a stone remain a stone, it would not change because you assume it is a gold.

Conclusion:
Stay focus on your concentration!!

Tuesday, July 11, 2006

Sunday, July 09, 2006

Berkshire's 40 Years Wisdom of Life 8: Diversification

"If only one variable is key to a decision, and the variable has a 90% chance of going your way, the chance for a successful outcome is obviously 90%. But if ten independent variables need to break favorably for a successful result, and each has a 90% probability of success, the likelihood of having a winner is only 35%." -- Warren Buffett, Letter To Shareholders, Berkshire Hathaway Inc., 2004.

Note: Given the chance, will you bet for the of winning with probability of 0.9 or 0.35? Put all the eggs in a basket after you study throughly realiability of the basket is always better than distribute the eggs into 10 different baskets without making a throughly studies. The more baskets, the harder you hold the basket and care for the eggs inside. "Diversification is the protection against igrorance."

Saturday, July 08, 2006

Berkshire's 40 Years Wisdom of Life 7: Creative Accounting

"We prefer better profits to better cosmetics.


Over the years, a number of very smart people have learned the hard way that a long string of impressive numbers multiplied by a single zero always equals zero. That is not an equation whose effects I would like to experience personally, and I would like even less to be responsible for imposing its penalties upon others." -- Warren Buffett, Letter To Shareholders, Berkshire Hathaway Inc., 2005.

Friday, July 07, 2006

Berkshire's 40 Years Wisdom of Life 6: Newton 4th Law of Motion

"Long ago, Sir Isaac Newton gave us three laws of motion, which were the work of genius. But Sir Isaac’s talents didn’t extend to investing: He lost a bundle in the South Sea Bubble, explaining later, “I can calculate the movement of the stars, but not the madness of men.” If he had not been traumatized by this loss, Sir Isaac might well have gone on to discover the Fourth Law of Motion: For investors as a whole, returns decrease as motion increases." -- Warren Buffett, Letter To Shareholders, Berkshire Hathaway Inc., 2005.
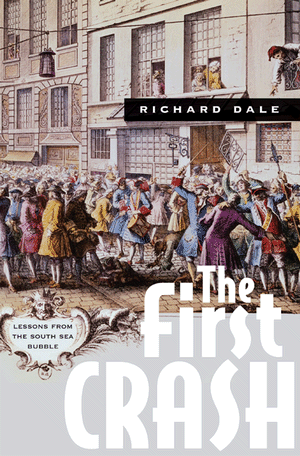
Note: Bank of England Museum, London is a place worth for visit if you wish to know more about the origin of South Sea Bubble.

Wednesday, July 05, 2006

Berkshire's 40 Years Wisdom of Life 5: CEO Pay


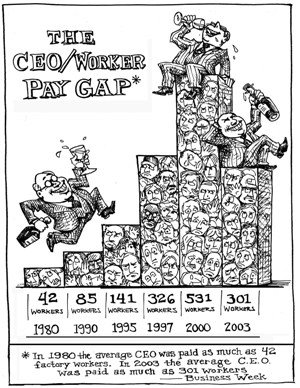
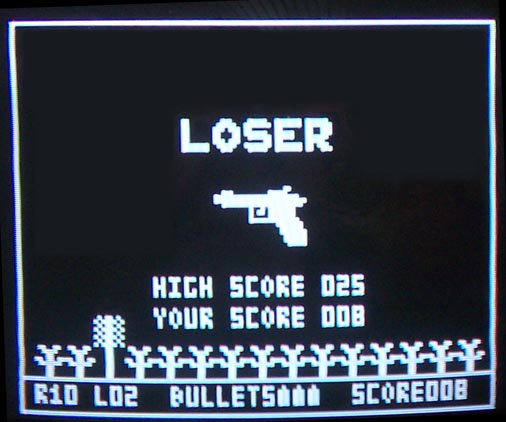
"Getting fired can produce a particularly bountiful payday for a CEO. Indeed, he can “earn” more in that single day, while cleaning out his desk, than an American worker earns in a lifetime of cleaning toilets. Forget the old maxim about nothing succeeding like success: Today, in the executive suite, the all too-prevalent rule is that nothing succeeds like failure." -- Warren Buffett, Letter To Shareholders, Berkshire Hathaway Inc., 2005

Monday, July 03, 2006

Loser's Game


“Investors have been so oversold on diversification that fear of having too many eggs in one basket has caused them to put far too little into companies they thoroughly know and far too much in others about which they know nothing at all. It never seems to occur to them that buying a company without having sufficient knowledge of it may be even more dangerous than having inadequate diversification.”
-- Philip Fisher in "Common Stocks and Uncommon Profits"

Sunday, July 02, 2006

Berkshire's 40 Years Wisdom of Life 4

"The attitude of our managers vividly contrasts with that of the young man who married a tycoon’s only child, a decidedly homely and dull lass. Relieved, the father called in his new son-in-law after the wedding and began to discuss the future:
“Son, you’re the boy I always wanted and never had. Here’s a stock certificate for 50% of the company. You’re my equal partner from now on.”
“Thanks, dad.”
“Now, what would you like to run? How about sales?”
“I’m afraid I couldn’t sell water to a man crawling in the Sahara.”
“Well then, how about heading human relations?”
“I really don’t care for people.”
“No problem, we have lots of other spots in the business. What would you like to do?”
“Actually, nothing appeals to me. Why don’t you just buy me out?”

(“Whose bread I eat, his song I sing.”)" -- Warren Buffett, Letter to Shareholders, Berkshire Hathaway Inc., 2005.